
There Is No Single Daily Water Number, and the Official Ones Count Food Too
U.S. reference intakes describe total water from drinks and food, and most healthy adults are guided well enough by thirst.
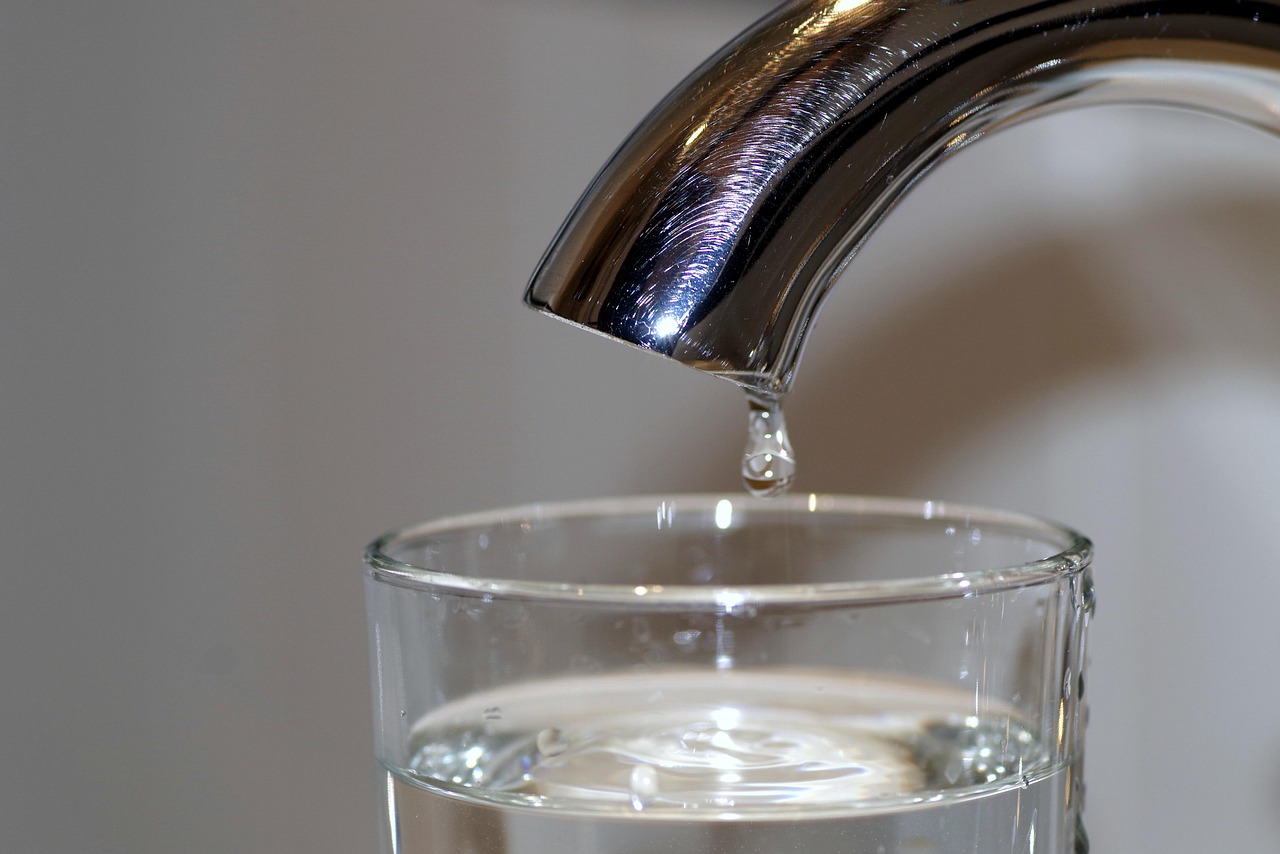
The familiar eight-glass rule is not an official figure. U.S. reference values of 2.7 L for women and 3.7 L for men cover all water from beverages and food, and individual needs vary widely. Evidence on extra water for kidney stones is mixed, and results for kidney disease are not yet established.
No single daily amount of water has been shown to suit every healthy adult. The best-known official figures, set by the National Academies in 2005, are about 2.7 liters (91 U.S. fluid ounces) a day for women and about 3.7 liters (125 ounces) for men. Those numbers count total water from every source: plain water, coffee, milk, juice, soup and the moisture in solid food. They are not instructions to drink that much from the tap.
The question matters because the advice people hear is often more rigid than the evidence behind it. Direct measurements show that the water the body turns over each day varies with body size, activity, climate and other factors. At the same time, two risks pull in opposite directions: too little fluid during heat or hard exercise, and too much fluid, which in rare cases dilutes blood sodium to dangerous levels. This article sets out what the sources in hand establish, what they leave open, and where the claims made for extra water outrun the trials.
What the official numbers actually measure
According to the National Academies' 2005 report on dietary reference intakes for water, the recommended levels are Adequate Intakes, or AIs. This category is used when evidence is too thin to calculate an average requirement, so an AI is a best estimate rather than a measured minimum. The report's figures came from national survey data: women who appeared adequately hydrated averaged about 2.7 L of total water a day, and men about 3.7 L, according to the National Academies' summary of the report.
The National Academies chapter on water describes the goal of the AI as preventing the mainly acute effects of dehydration, such as metabolic and functional abnormalities. For adults aged 19 to 30, the values of 3.7 L and 2.7 L correspond to median intakes in the survey data. In practical terms, the AI describes what healthy people drink. It does not show that drinking more would improve health, or that drinking somewhat less would harm it.
The National Academies' announcement says the values apply to healthy, sedentary people in temperate climates. Those who are very physically active or who live in hot climates may need more. The panel also judged that intake driven by thirst, along with habitual beverage consumption at meals, is enough for the average person to stay adequately hydrated day to day. Temporary shortfalls can occur with heat exposure, high activity, or reduced food and fluid intake.
The balance studies behind the estimate
The National Academies chapter also cites older water-balance studies, which suggest that resting adult men need about 2.5 L a day to stay in balance. Those studies date from 1930 and 1933. That is a reminder that the evidence base for human water needs is older and thinner than the confidence of many hydration slogans implies.
How the U.S. and European values compare
European values are lower. Two secondary reference pages summarizing the European Food Safety Authority's 2010 opinion list AIs of 2.5 L a day for men and 2.0 L for women, again for total water. The primary EFSA document was not available for this article, so the reasons for the gap between the two sets of numbers cannot be explained here. What the comparison does show is that expert panels looking at similar populations arrived at different figures, which fits the picture of an estimate rather than a fixed biological quantity.
| Body | Year | Men | Women |
|---|---|---|---|
| US/Canada National Academies | 2005 | 3.7 L (about 125 US fl oz) | 2.7 L (about 91 US fl oz) |
| EFSA (secondary sources only) | 2010 | 2.5 L | 2.0 L |
What Americans actually drink
The Centers for Disease Control and Prevention, drawing on the National Health and Nutrition Examination Survey (NHANES) for 2015 to 2018, reports that U.S. adults drank an average of 44 ounces of plain water a day. Children and adolescents averaged 23 ounces. Consumption varied by age, race and ethnicity, and socioeconomic status.
Those figures cannot be set directly against the official intakes. They cover plain water only, gathered from self-reported recall, and leave out tea, coffee, milk, juice and the water in food. A shortfall against 2.7 L or 3.7 L cannot be inferred from them, because much of total water arrives by other routes.
Earlier surveys paint a similar picture. A 2013 article in the CDC journal Preventing Chronic Disease, citing a USDA brief, reported that mean plain-water intake among adults 20 and older in 2005 to 2008 was 4.4 cups for men and 4.3 cups for women. The USDA brief itself, based on one day of dietary recall from 17,081 people aged 2 and older, found that 76% drank some plain water on a given day and that average intake was 3.9 cups per person across all ages. The surveys come from different cycles and used different samples, so a rise or fall between them should not be read from these numbers alone.
A study of NHANES 2011 to 2014 by Rosinger and colleagues, published in Public Health Nutrition, found that 81.4% of adults drank plain water on a given day. Some 55.2% drank tap water and 33.4% drank bottled water. In a National Cancer Institute survey of 3,397 adults, people described their own habits: 7% reported drinking no water daily, 36% reported 1 to 3 cups, 35% reported 4 to 7 cups, and 22% reported 8 cups or more. The survey's year was not available in the material reviewed for this article, and all of it is self-report.
Recall surveys carry their own error. The authors of a 2022 Science study on water turnover state that dietary survey methods probably underestimate water intake compared with isotope measurement. Intake figures from recall are therefore best treated as approximate.
Why one number cannot fit everyone
The strongest direct evidence on individual variation comes from Yamada and colleagues, published in Science in November 2022. The team pooled hydrogen-isotope (²H) tracking data on 5,604 people, ranging in age from 8 days to 96 years, from 23 countries. The method follows how quickly a tracer leaves the body, which gives a measure of water turnover: the amount used and replaced each day.
Turnover was significantly associated with age, body size and body composition. It also tracked physical activity, athletic status, pregnancy, socioeconomic status, and environmental conditions including latitude, altitude, air temperature and humidity. People in countries with lower scores on the Human Development Index had higher turnover than people in higher-scoring countries. The study reports this as an association. The causes were not established in the material reviewed here.
Differences between the sexes, and the pattern across adult ages, largely reflected body fat percentage. Fat tissue contains less water than muscle and other organs, so people with more fat tend to turn over less water for a given size. The authors also built a prediction equation that uses physical activity level, body weight, sex, humidity, athlete status, Human Development Index, altitude and age.
Turnover is not the same as drinking
The authors caution that turnover is not equal to the amount a person needs to take in from liquids and foods. Intake from drinks and food is about 85% of turnover, because turnover also includes metabolic water and water absorbed through air and skin. The study is also cross-sectional and draws on existing isotope studies, so it describes how much water people turn over rather than the amount that would optimize health. Details such as mean turnover by age and sex, and the study's funding, were not retrieved for this article.
The Science authors also describe total body water as tightly regulated from day to day. Thirst and hunger drive intake of fluids and food to offset what is lost. That physiological account explains why a fixed target is less useful than it sounds: the body adjusts intake against its own losses, and those losses depend on weather, work and size.
Thirst, exercise and the risk of drinking too much
The best-studied danger of overdrinking is exercise-associated hyponatremia, or EAH. An Endocrinology Advisor feature defines it as blood sodium below 135 mmol/L that develops during exercise or within 24 hours afterward. The Third International EAH Consensus Conference, held in 2015 and published in the Clinical Journal of Sport Medicine, identified the primary cause as overconsumption of hypotonic fluids, probably combined with non-osmotic stimulation of the hormone vasopressin.
A 2017 review in Frontiers in Medicine by Rosner and colleagues reaches a similar conclusion. Work since the 1980s, it says, has pointed to drinking beyond thirst, together with non-osmotic vasopressin release, as the most common causes. The review adds that cases have spread across a wider range of sporting activities despite greater awareness of the hazards of overdrinking.
The consensus panel's practical conclusion was that relying on the innate thirst mechanism should limit excess drinking and hyponatremia while still supplying enough fluid to prevent excessive dehydration. In its wording, the safest individualized strategy is to drink palatable fluids when thirsty. Wilderness Medical Society guidelines from 2020, as described in a press release, likewise identify prolonged overhydration during exercise as the primary risk factor for all forms of EAH. They advise participants to drink enough to satisfy thirst but to avoid overdrinking.
Even the drink-to-thirst guidance comes with a caveat. The Wilderness Medical Society's authors note that no single fluid recommendation will work across the range of activities, climates, sweat rates, body masses and exercise intensities. These documents are expert consensus statements about exercise, not trials of everyday drinking, so they do not speak to how much someone sitting at a desk should consume.
How often EAH occurs was not established in the material reviewed here, so no frequency should be inferred. The evidence supports the mechanism and the expert guidance, but not a statement about how common the condition is.
Does extra water protect the kidneys?
The most developed trial evidence on water as a health intervention concerns kidney stones. A 2020 Cochrane review by Bao and colleagues found no randomized trials of increased water intake for first-time stone prevention in people with no history of stones. For people who had already had stones, it found one randomized trial. Pooling that single trial, the review concluded that more water may reduce recurrence, with a relative risk of 0.45 (95% confidence interval 0.24 to 0.84) across 199 participants, and rated the certainty of the evidence as low. That works out to 149 fewer recurrences per 1,000 people over five years, against 270 per 1,000 in the control group.
The trial in question is Borghi and colleagues' 1996 study, summarized in a "Seminal papers in urology" article. It randomized 99 patients to increased fluid intake and 100 to usual care for five years. Recurrence was 12.1% in the first group and 27% in the second (p = 0.008), and no adverse events were reported. The participants had a history of calcium stones, and the aim was a urine volume above 2 L a day rather than a fixed amount of drinking.
A larger 2026 trial finds no benefit from a program
A newer and much larger randomized trial, called PUSH, reported a different result in 2026. According to a blog post from the American Academy of Family Physicians, it tested a two-year behavioral program designed to raise fluid intake in 1,658 people aged 12 and older with prior kidney stones, recruited at six U.S. medical centers. By the end, 19% of the intervention group and 20% of the controls had passed a stone or had a procedure for one.
The same account explains part of the result: average urine volume in the intervention group peaked at 1.8 L at six months and fell below 1.6 L by 24 months, so the target was not sustained. The trial therefore says more about how hard it is to change drinking habits than about whether higher intake works when it is achieved. Renal & Urology News reported that the authors do not see the findings as undermining the importance of increasing fluid intake, which they describe as low-cost and low-risk with likely benefits based on earlier literature. The primary PUSH paper was not available for this article, so these details rest on secondary reports.
Chronic kidney disease remains open
For chronic kidney disease, the picture is less settled. The protocol for the CKD Water Intake Trial says observational studies link higher water intake with slower decline in kidney function, and the trial was designed to test that in a randomized setting. It is a parallel-group, open-label trial across nine centers with one year of follow-up. The results were not confirmed in the material reviewed, so no conclusion about water and kidney disease can be drawn here. People with kidney, heart or liver disease, or those taking certain medications, need guidance from a clinician about fluids.
What it means in practice
The sources support a modest message rather than a number. Official intakes are descriptions of what healthy people typically consume, spread across drinks and food, and they sit in a range that varies by body, work and weather. For most healthy adults, normal meals, regular beverages and thirst appear to be enough, and during prolonged exercise, drinking to thirst is the strategy expert panels favor over fixed schedules.
What to watch is the evidence that is still arriving. Trials in kidney disease, fuller reporting of the 2026 stone trial, and long-term studies in healthy people would show whether deliberately raising intake pays off beyond avoiding dehydration. Until then, a larger glass count is a habit, not a proven health intervention.
Frequently asked questions
Is eight glasses of water a day an official recommendation?
No. The official U.S. and Canadian values from the National Academies are about 2.7 L for women and 3.7 L for men, and they cover total water from beverages and food. The origin of the eight-glass rule was not verified in the research reviewed for this article.
Does coffee or food count toward daily water intake?
The National Academies' reference values are for total water, meaning water from plain water, other beverages and food. They are not a target for plain water alone. Plain-water figures from surveys such as NHANES leave out other drinks and food, so they understate total intake.
Is thirst a reliable guide to how much to drink?
The National Academies panel judged that thirst and habitual drinking at meals are enough for the average person to stay adequately hydrated. Expert consensus statements from 2015 and 2020 advise drinking to thirst during exercise. The material reviewed did not cover older adults, people who are ill, or those with conditions that affect thirst.
Can a person drink too much water?
Yes, though the best-documented danger is exercise-associated hyponatremia, blood sodium below 135 mmol/L during or within 24 hours after exercise. Consensus statements identify overdrinking, along with non-osmotic vasopressin release, as the main cause. How often it happens was not established in the sources reviewed.
Does drinking more water prevent kidney stones?
For people who have had calcium stones, a 2020 Cochrane review found low-certainty evidence from one trial that more water may reduce recurrence. A larger 2026 trial of a behavioral program found 19% versus 20% stone events, but participants did not sustain higher urine volume. No randomized trials were found for people who have never had a stone.
Sources
- Report Sets Dietary Intake Levels for Water, Salt, and Potassium To Maintain Health and Reduce Chronic Disease Risk , National Academies
- Dietary Reference Intakes for Water, Potassium, Sodium, Chloride, and Sulfate (chapter on water) , National Academies Press / Institute of Medicine (2005-01-01)
- Fast Facts: Data on Water Consumption , Centers for Disease Control and Prevention
- Behaviors and Attitudes Associated With Low Drinking Water Intake , Preventing Chronic Disease, CDC (2013-01-01)
- Drinking Water Intake in the U.S. - FSRG Dietary Data Briefs , USDA Food Surveys Research Group via NCBI Bookshelf
- Disparities in plain, tap and bottled water consumption among US adults: NHANES 2007–2014 , Public Health Nutrition (Cambridge University Press)
- Variation in human water turnover associated with environmental and lifestyle factors , Science (2022-11-25)
- Variation in human water turnover associated with environmental and lifestyle factors - PubMed , National Library of Medicine (2022-11-25)
- Water intake: EFSA vs US/Canada adequate intakes , fitmathhub.com
- How Much Water by Weight (kg & lbs) , howmuchfluid.com
- Statement of the Third International Exercise-Associated Hyponatremia Consensus Development Conference , Clinical Journal of Sport Medicine (hosted copy) (2015-01-01)
- 'Drink when thirsty' to avoid fatal drops in blood sodium levels during exercise , ScienceDaily (2015-06-29)
- Exercise-Associated Hyponatremia: 2017 Update , Frontiers in Medicine (2017-03-03)
- Patients with exercise-related hyponatremia advised to 'drink to thirst' , EurekAlert (2020-03-18)
- Exercise-Associated Hyponatremia: Prevention and Treatment Recommendations , Endocrinology Advisor
- Water for preventing urinary stones , Cochrane Database of Systematic Reviews (2020-01-01)
- Increased water intake for preventing urinary stones , Cochrane
- Seminal papers in urology: urinary volume, water and recurrences in idiopathic calcium nephrolithiasis: a 5-year randomized prospective study , NCBI / PubMed Central
- Does Advice to Drink More Fluids Prevent Recurrent Kidney Stones? , American Academy of Family Physicians (2026-01-01)
- Trial Targeting Fluid Intake Did Not Reduce Symptomatic Kidney Stones , Renal & Urology News (2026-01-01)
- The Chronic Kidney Disease Water Intake Trial: Protocol of a Randomized Controlled Trial , NCBI / PubMed Central
This article was drafted with the help of AI and reviewed by Jaroha editors before publication.