
Gold near $4,100 is a rebound, not a record: what each way to own it costs
The price has hovered around $4,000 for a year, sits well below January's peak, and says little about whether buying now makes sense.
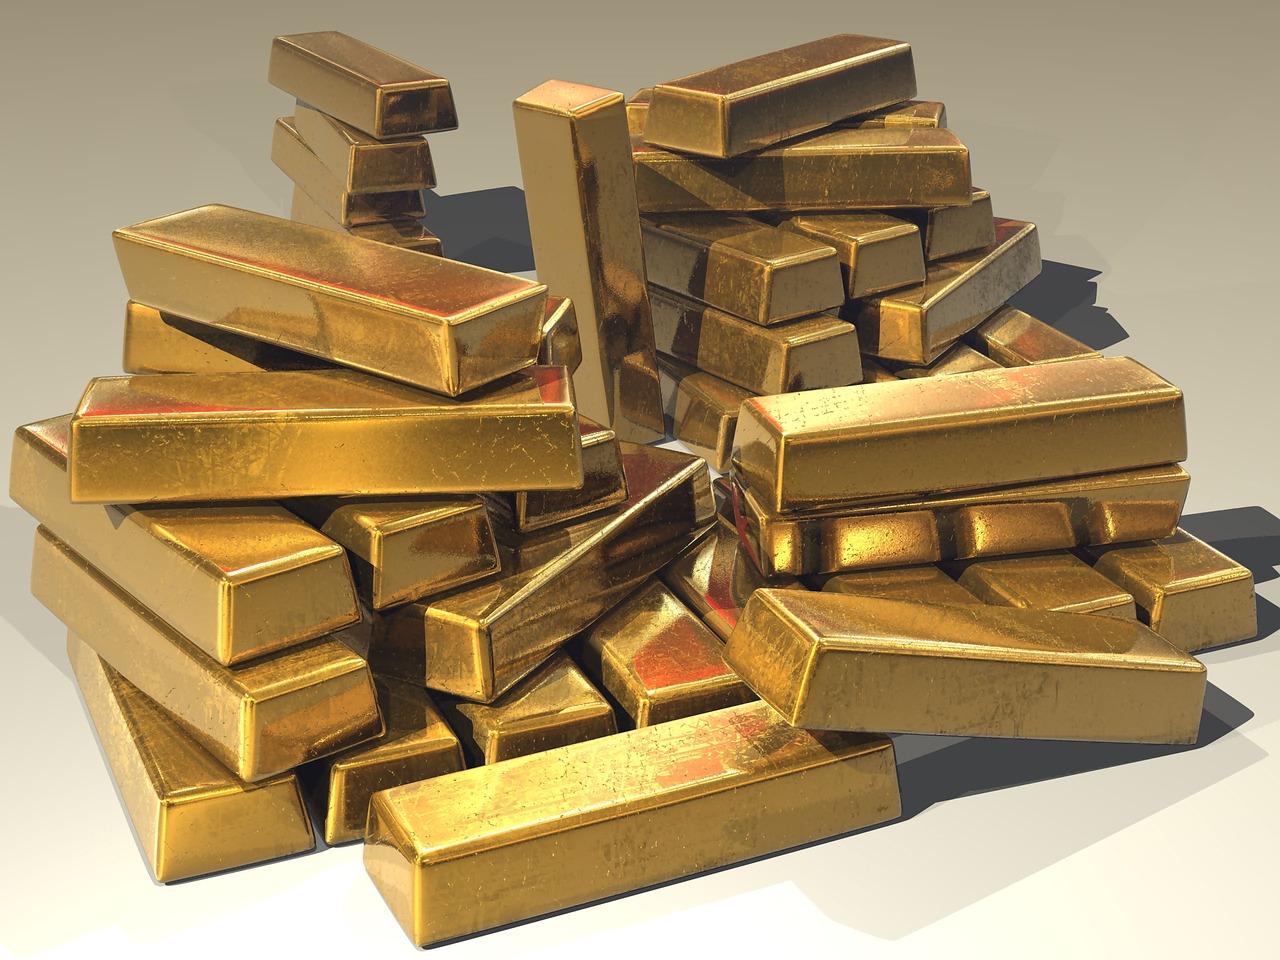
Gold is trading near $4,100 an ounce on Nov 5, 2026, about 26% below its January high and roughly where it was a year ago. The cost of owning it differs far more by route than the headline price suggests: ETF fees, coin premiums and tax treatment all vary widely.
Gold is trading around $4,100 an ounce on Nov 5, 2026, but the move is a rebound rather than a milestone. Kitco showed spot gold at $4,125.20 per troy ounce at 1:55 a.m. ET, and the dealer JM Bullion showed $4,140.15 a couple of hours later. Gold is not at a record: it peaked at about $5,600 in January and has spent roughly a year in the neighborhood of $4,000.
For an ordinary investor, the headline price matters less than the route taken to own the metal. Exchange-traded funds, coins and bars, and mining stocks differ sharply in what they cost, how they are taxed and what they actually track. This article lays out those differences from the research available as of Nov 5. It offers context, not personal advice, and does not answer whether anyone should buy.
A rebound, not a breakout
The framing that gold "topped $4,000 on Nov 5" skips over the past year. Macrotrends data shows gold at $4,002 on roughly Nov 3, 2025, and at $3,929 on Nov 3, 2026. At that latest reading the metal was down 9.1% for 2026 so far and roughly flat over twelve months.
Gold was already back above $4,000 the day before. Trading Economics reported a jump of about 2.6% to $4,035 on Wednesday, Nov 4, and attributed it to a weaker dollar after the midterm elections. That explanation comes from a single source and is unverified, and the research found no firm account of what drove the Nov 5 move beyond that rebound continuing.
Where the price sits on a longer path
CBS News reported that gold started 2025 at about $2,624 an ounce. Against that starting point, today's price is roughly 57% higher, by Jaroha's own arithmetic. The surge then carried gold to a record intraday high of $5,589.38 on Jan 28, 2026, according to StoneX, a figure CBS also reports.
Record-high figures vary by source because they measure different things. EBC cites a Jan 29 spot high of $5,595.47 and an LBMA PM price of $5,405 that day, while other sources give peaks of $5,602 and $5,608.35. A fair summary is "about $5,600 intraday," with the measure named. Against that peak, today's price is about 26% lower, again by Jaroha's arithmetic.
The World Gold Council (WGC) reports that the LBMA PM price averaged $4,262 an ounce in the third quarter of 2026. That was the third-strongest quarterly average on record and 23% higher than a year earlier. Goldreporter.de, a German market commentary site, put gold at $4,126.93 on Nov 5, down 4.4% for the year in dollars. The difference from Macrotrends' 9.1% reflects the different prices on the two dates; the two figures are consistent with each other.
Longer-run returns look spectacular but need care. Macrotrends shows annualized nominal growth of 17.4% over five years and 11.7% over ten. Both windows are dominated by the 2024–26 rally, so they describe what happened and are not an expectation of what comes next.
Route one: gold ETFs
Physically backed gold ETFs are the simplest way to track the price. Three funds dominate US trading: SPDR Gold Shares (GLD), iShares Gold Trust (IAU) and SPDR Gold MiniShares (GLDM). According to etf.com, their expense ratios are 0.40% for GLD, 0.25% for IAU and 0.10% for GLDM, and Benzinga's comparison table gives the same figures.
Those percentages translate to small dollar amounts that still differ by a factor of four. On a $100,000 holding, etf.com calculates about $100 a year for GLDM, $250 for IAU and $400 for GLD. The chart below scales the same arithmetic to $10,000.
| Label | Annual fee in USD per $10,000 invested |
|---|---|
| GLDM (0.10%) | 10 |
| IAU (0.25%) | 25 |
| GLD (0.40%) | 40 |
Why the biggest fund is not the cheapest
GLD is the largest of the three, with about $142 billion in assets, against roughly $66 billion for IAU. As of a January 2026 article, GLDM held about $27 billion. These figures come from different dates and should not be compared too tightly. Size brings liquidity, and GLD is described in the research as the practical choice for options trading, which may justify its higher fee for some traders.
The funds also differ in how much gold a share represents. GLD holds roughly 1/10 of an ounce per share and GLDM roughly 1/100 of an ounce, per etf.com. The same etf.com page is inconsistent on IAU, giving 1/50 in text and 1/100 in a table, so the fund's prospectus is the place to check that number.
Fees compound quietly. A Yahoo Finance article reports ten-year returns of 224% for GLD and 229% for IAU, a gap it attributes almost entirely to the fee difference. That comes from a single secondary article rather than fund documents, so it illustrates the principle more than it proves a number.
A 2019 marketing document that SPDR Gold Trust filed with the SEC explains the mechanism: the fund produces no income and regularly sells small amounts of gold to pay its expenses. The gold behind each share therefore shrinks slowly over time. The document is dated, but the structure it describes is built into how such funds operate.
One cost is missing from this comparison. The research did not source brokerage bid-ask spreads, so the fee figures above are ongoing expenses only and do not capture every cost of trading a fund.
Route two: coins and bars
Physical gold carries its costs up front. Dealers sell coins and bars at a premium over the spot price, and the size of that premium depends on the product, the quantity and the dealer. Every figure in this section comes from dealers or price aggregators that sell or promote bullion, so each has a commercial interest.
For a 1-ounce American Gold Eagle, USAGold says the premium is typically 4% to 8%, MetalCharts says 5% to 7%, and GoldValueHub says 5% to 8%. A sampling of four US dealers by MetalsRadar on Oct 5, 2026, found a lower range, 1.8% to 4.6%. The sound reading is a few percent to the high single digits, with the range depending on who is selling and when.
Applied to a spot price near $4,125, a 5% to 8% premium puts a 1-ounce Eagle at roughly $4,330 to $4,455, by Jaroha's arithmetic. The spread between dealers can be large on a single day. MetalsRadar's data showed the same Eagle at $4,216.41 at one dealer and $4,334.48 at another, a gap of $118.07.
Smaller pieces cost more per ounce
The premium rises as the piece shrinks. The research found a 1-gram bar priced about 20% over spot and a 1/10-ounce Eagle selling at a premium above 10%. Rule-of-thumb ranges for 2026 put the Canadian Maple Leaf at 4% to 6%, the Krugerrand at 3% to 5% and a 1-kilogram bar at 1% to 3%, with larger orders usually earning a discount of one to three percentage points.
The exit price matters as much as the entry
Selling brings a second cost. GoldSilver says buyback prices for sovereign coins are typically 1% to 2% below spot, while GoldValueHub says dealers pay at or near spot for Eagles. GoldSilver estimates the round-trip cost on a 1-ounce Eagle at roughly 4% to 8% of the metal's value.
Because both ends count, a lower premium does not automatically mean a cheaper coin. By the research's example, an Eagle bought at 7% over spot and sold at 2% over spot costs 5%, the same as a Krugerrand bought at 4% over and sold at 1% under. At about $4,125 spot, a 4% to 8% round trip works out to roughly $165 to $330 per ounce, by Jaroha's arithmetic.
Route three: mining stocks
Gold miners are companies, not metal. Benzinga describes the three bullion ETFs as essentially bets on gold itself and the VanEck Gold Miners ETF (GDX) as a bet on mining companies, and a higher-beta way to trade gold. In plain terms, miner shares can move more than the metal in either direction.
That is the extent of what the research supports. It did not retrieve GDX's fee, miners' profit margins or how miners have performed against bullion, so any claim about their relative returns would be guesswork. What can be said is that a miner fund brings company-level risks that a bar in a vault does not, and that its tax treatment differs, as described next.
How the tax treatment differs
CNBC reports that the IRS treats gold, and ETFs backed by physical gold, as collectibles. For assets held longer than a year, collectibles face a top long-term capital gains rate of 28%, against a top rate of 20% on stocks and bonds. CNBC adds that the collectibles rate applies only to ETFs structured as trusts.
The 28% figure is a ceiling, not a flat rate. Long-term gains on collectibles follow the ordinary tax brackets up to that cap, so lower earners may pay less. Short-term gains on collectibles are taxed as ordinary income, up to 37%, according to Vaulted, a gold vendor, citing IRS Topic 409. SmartAsset says gold mining stocks generally qualify for regular capital gains rates.
The practical implication is that two investors with identical pre-tax gold profits can owe different amounts depending on the route and their bracket. For higher earners, the collectibles cap can make physical gold and trust-structured gold ETFs less tax-efficient than stocks.
Who is buying, and who is not
The World Gold Council's Gold Demand Trends report for the third quarter of 2026, published Nov 3, shows a split market. Total demand fell 1% from a year earlier to 1,369 tonnes, though its dollar value rose 22% to $188 billion because of higher prices.
Central banks and other official institutions added a net 321 tonnes, up 42% from a year earlier and the most since the fourth quarter of 2024. Only 120 tonnes of that was reported, and unreported activity made up about 63% of the quarter's estimated demand. Year-to-date central bank buying reached 675 tonnes, 6% above 2025. Central banks buy for reserve diversification, not to time a price a retail investor faces.
Physically backed gold ETFs took in 211 tonnes in the quarter, reversing outflows in the second quarter, and total holdings reached a record 4,256 tonnes. Retail buyers of physical gold moved the other way: bar and coin demand fell 19% to 268 tonnes, which the WGC links to the lack of a clear price trend. Jewelry demand dropped 17% to 313 tonnes as prices stayed high.
The WGC's own summary is that ETF inflows returned strongly while retail investors held back amid uncertainty over the price outlook. One secondary report calls the bar-and-coin figure the lowest quarterly level in four years, but that was not confirmed in the WGC's own text. A Seeking Alpha summary of the WGC data adds that jewelry demand has fallen for 13 straight quarters.
The WGC is an industry body, and an SEC filing for GLD states that it is an affiliate of the fund's sponsor. Its numbers are the standard reference for the market, but its commentary is informed rather than neutral.
What a $4,000 price tells and does not tell
The price establishes a few things. Gold is far above where it began 2025, well below its January 2026 peak, and close to where it traded a year ago. StoneX says the January high was the first time gold exceeded its 1980 inflation-adjusted peak. EBC says the January spot record was about 58% above that inflation-adjusted level, though that figure could not be verified from a primary source.
The price does not say whether gold is cheap or expensive. It is a nominal dollar figure, and it ignores inflation, the strength of the dollar and interest rates. The research found no study linking those factors to gold's price, so any claim about how they will move it would go beyond the evidence.
Forecasts illustrate how little the level settles. Trading Economics' model expects $3,815 by the end of the quarter and $3,530 in twelve months. Another aggregator cites bank base cases of $4,742 to $5,400 by late 2026, a range already stale against today's price. The two views disagree sharply, and neither is reliable evidence of future prices.
The "gold is booming" story also needs balance. Retail bar-and-coin demand fell in the third quarter, and the buyers the WGC highlights are institutions with different goals from a household's. Trading Economics shows gold up 3.8% on the year on its CFD contract, while Macrotrends shows it roughly flat, so even the one-year picture depends on the measure and date used.
What to watch from here
The cost gap among routes is the part of the decision that does not depend on a forecast. A fund fee of $10 to $40 per $10,000 a year is small beside a coin round trip that can run several hundred dollars per ounce, though the sources for the coin figures are all sellers and the ranges are wide. Tax treatment adds another layer that depends on the investor's bracket and holding period.
What remains unresolved is direction. Institutional buyers are adding gold while retail buyers hesitate, and forecasts disagree by more than $1,000 an ounce. The next WGC demand report and whether gold holds its footing above $4,000 will show more than the headline number does today.
Frequently asked questions
What is the gold price today?
Kitco showed spot gold at $4,125.20 per troy ounce at 1:55 a.m. ET on Nov 5, 2026, and JM Bullion showed $4,140.15 at 3:58 a.m. EST. Quotes differ by a few dollars by vendor and time.
Is gold at a record high?
No. Gold's record intraday high was $5,589.38 on Jan 28, 2026, according to StoneX, and other sources put the peak near $5,600 depending on the measure. Today's price is about 26% below that peak, by Jaroha's arithmetic.
Which gold ETF has the lowest fee?
Among the three largest, GLDM charges 0.10% a year, IAU 0.25% and GLD 0.40%, according to etf.com and Benzinga. On $10,000 that is $10, $25 and $40 a year. Bid-ask spreads were not sourced, so the fee is not the full cost of trading.
How much extra do gold coins cost over the spot price?
Dealer and aggregator sources put 1-ounce American Gold Eagle premiums between about 2% and 8%. Smaller coins and bars cost more per ounce, and selling back typically costs another 1% to 2% below spot for sovereign coins, according to GoldSilver. All of these sources sell or promote bullion.
How is gold taxed in the US?
CNBC reports that the IRS treats physical gold and trust-structured gold ETFs as collectibles, with a top long-term rate of 28%, compared with 20% for stocks. Vaulted, a gold vendor, says short-term gains are taxed as ordinary income, up to 37%. Current rules should be confirmed with the IRS or a tax professional.
Sources
- Gold Price Today , Kitco (2026-11-05)
- Gold - Price - Chart - Historical Data - News , Trading Economics (2026-11-05)
- Gold Price Today - Live Gold Spot Price Charts , JM Bullion (2026-11-05)
- Goldpreis heute am 5. November 2026 , Goldreporter.de (2026-11-05)
- Gold Price - 10 Year Daily Chart , Macrotrends (2026-11-03)
- What Was the Highest Price for Gold? , StoneX Bullion (2026-01-01)
- What is the highest gold price in history? Here's how it's changed over the past year. , CBS News (2026-02-24)
- Highest Gold Price Ever: How Gold Reached $5,595 Faster Than Past Cycles , EBC (2026-09-01)
- Central bank buying and ETF inflows support gold demand in Q3 , World Gold Council (2026-11-03)
- Gold Demand Trends: Q3 2026 , World Gold Council (2026-11-03)
- Gold Demand Trends: Q3 2026 , Seeking Alpha (2026-11-01)
- GLD vs GLDM vs IAU: Which Gold ETF Should You Actually Buy? , etf.com (2026-01-01)
- Gold Down 20% from Iran-War Peak: ETF Best Positioned for a Rebound , Benzinga (2026-10-01)
- GLD vs. IAU: Which Gold ETF Costs You Less Over Time? , Yahoo Finance (2026-01-01)
- Gold ETFs: GLDM Offers Lower Costs, While IAU Boasts More Assets Under Management , Motley Fool (2026-01-24)
- SPDR Gold Trust, Form FWP , U.S. Securities and Exchange Commission (2019-01-01)
- Gold ETF investors may be surprised by their tax bill on profits , CNBC (2025-05-01)
- Gold, silver ETF owners face 28% top tax rate on profits. That's higher than levies on stocks , CNBC (2022-03-14)
- How Do I Avoid Capital Gains Tax on Gold? , SmartAsset (2026-01-01)
- Gold and Silver Taxes Explained (IRS + State Rules) , Vaulted (2026-01-01)
- American Gold Eagle Value & Buying Guide (2026) , USAGold (2026-01-01)
- Understanding Buyback Spreads , GoldSilver (2026-01-01)
- Gold Premium Over Spot: What You Really Pay (Dealer Data) , MetalsRadar (2026-10-05)
- Bullion Coin Premiums: Typical Gold & Silver Premiums Over Spot , MetalCharts (2026-01-01)
- American Gold Eagle Value Today: Live Price Chart (2026) , GoldValueHub (2026-10-07)
- Gold Coin Premiums: Eagles, Maples, Krugerrands, and Buffaloes Compared , GoldSilverSelect (2026-01-01)
- Gold Dealer Markup 2026: How Much Over Spot Is Normal? , BestGold.company (2026-01-01)
This article was drafted with the help of AI and reviewed by Jaroha editors before publication.